About ROIVert
ROIVert is software for the analysis of time-lapse microscopy.
ROIVert allows you to draw regions of interest (ROIs) on an image (or a movie) and visualize how pixels in that region change over the course of time. ROIVert was designed to support analysis of recordings of GCaMP signals in Drosophila neurons, but has broad applications to time-lapse microscopy. If you think ROIVert might be helpful for your application, give it a try, and let us know if there are features we can add!
Draw ROIs on videos and compute change in intensity over time.
Integrated graphing system for modern, customizable, visualizations.
Image processing with real-time display adjustment.
Custom window layouts for a variety of workflows.
Get ROIVert
ROIVert is free and open source under the MIT License. Click this link for more information about ROIVert's license. Download ROIVert v1.1 by clicking the image associated with your platform below.
|
|
|
Source Code: contribute to ROIVert.
Release Notes: see what's new or download old releases.
Learn ROIVert
ROIVert is easy to use - simply load a dataset, click to draw ROIs, and you'll see graphs showing time-varying normalized intensities. Below are some details in case you get stuck, a little bit about the various kinds of math ROIVert uses,and some tips for being effective in ROIVert.
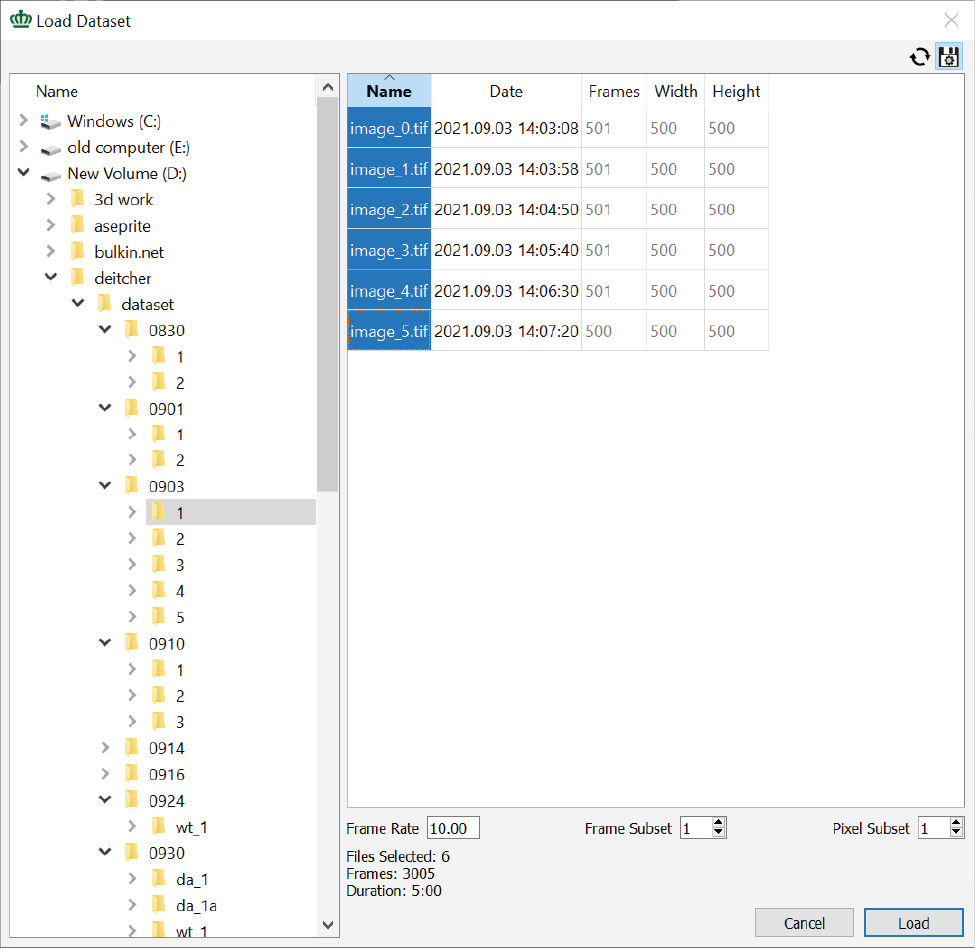
When you first start ROIVert you'll see a "Load Dataset" window. ROIVert works with the Tag Image File Format (also known as TIFF or TIF). TIFF is a flexible format for storing images - a single TIFF file can hold one or more than one images, and it can store those images in a variety of ways. ROIVert supports both single and multi-page TIFF files, and you can even select multiple multi-page TIFF files. However, ROIVert currently only supports 8-bit grayscale images, and has two rules about how you store your data:
- All of the files must be in the same folder.
- The files are loaded in alphabetical order.
To select which files you want to load, click and drag in the "Name" column. The highlighted files will be loaded. Note that down at the bottom right of the window, ROIVert will note the number of files you've selected and the total number frames.
Also at the bottom right, you'll see three text boxes:
- Frame Rate: This is the number of frames in your dataset that correspond to 1 second. The value is used to determine how fast to play the video, and to select values for the x axes in plots.
- Frame Subset: This allows you to load only a subset of frames. For instance, if you choose the number 2, ROIVert will load every other frame.
- Pixel Subset: This is the spatial equivalent of Frame Subset, it allows you to load a subset of pixels.
When you've selected all of these options, you can click the Load button. You'll see a window with some
progress bars show up while ROIVert loads the data and performs some initial calculations. The Image
Data Window will close
automatically, but if you want to reload some different data, you can bring it up again with the  button in the toolbar.
Tips and Warnings
- Use Ctrl+A (⌘+A on Mac) in the file area to select all files.
- You can drag TIFF files from Explorer (Finder on Mac) to the Load Dataset Window.
- Files are always processed in alphabetical order, if you have files with numeric suffixes (image1.tif, image2.tif, image3.tif) be sure to pad with zeros as ROIVert will place image10.tif before image9.tif.
- The entirety of a multi-frame file must be loaded before ROIVert can downsample it, so using Frame Subset won't speed up the process much for these files.
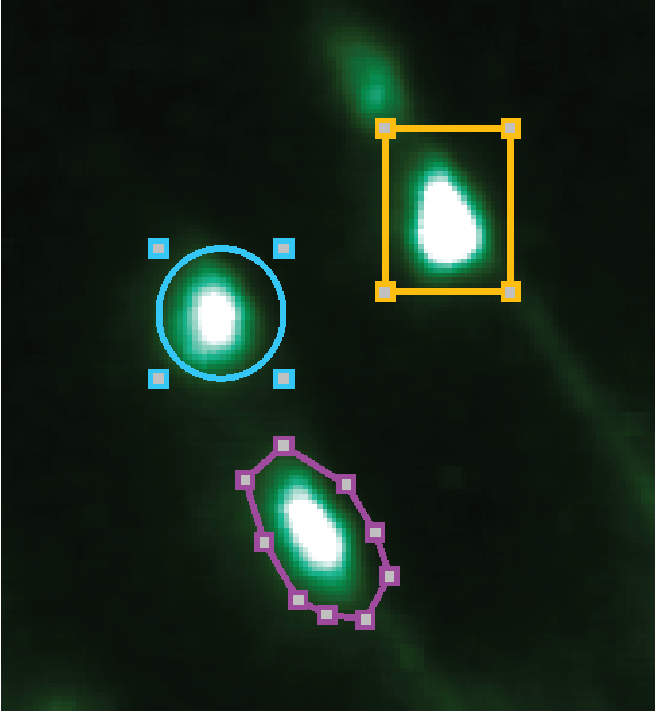
ROIVert works with three shapes of ROIs. Drawing ROIs is easy – just point and click, but ROIVert comes with a few features to make life easier. You can find buttons for the three different types of ROIs in the toolbar, displayed at the left by default.
 Rectangular ROIs are the simplest, and probably look
the least like a cell (biology doesn't produce too many sharp corners!). These ROIs are useful for
a quick look, or for getting a measurement of large swaths of an image. To draw a rectangular ROI
point the mouse at one corner, depress the mouse button, drag to set the other corner, and release the
mouse button.
Rectangular ROIs are the simplest, and probably look
the least like a cell (biology doesn't produce too many sharp corners!). These ROIs are useful for
a quick look, or for getting a measurement of large swaths of an image. To draw a rectangular ROI
point the mouse at one corner, depress the mouse button, drag to set the other corner, and release the
mouse button.
 Elliptical ROIs work just like rectangular ROIs,
but the mouse action is setting 'imaginary' corners that correspond to at box that tightly encloses
the ellipse.
These ROIs are good for cell bodies, and even though sometimes cells won't make perfect ellipses
this ROI shape often does a 'good enough' job.
Elliptical ROIs work just like rectangular ROIs,
but the mouse action is setting 'imaginary' corners that correspond to at box that tightly encloses
the ellipse.
These ROIs are good for cell bodies, and even though sometimes cells won't make perfect ellipses
this ROI shape often does a 'good enough' job.
 Polygonal ROIs are the most advanced. With polygons you
can make
just about any shape you can imagine. With polygonal ROIs you still depress the mouse button to
start moving a point and release to confirm that point, but you can have as many points (vertices)
in your polygon as you like. When you're happy with the shape of your polygon, simply click on the
first point to complete the shape.
Polygonal ROIs are the most advanced. With polygons you
can make
just about any shape you can imagine. With polygonal ROIs you still depress the mouse button to
start moving a point and release to confirm that point, but you can have as many points (vertices)
in your polygon as you like. When you're happy with the shape of your polygon, simply click on the
first point to complete the shape.
For all the different shapes of ROI, you'll notice some little squares show up at the vertices you defined. These allow you to edit the ROI you just drew: drag these points to edit the shape.
The selection squares show up automatically for the ROI you just drew, because this ROI is
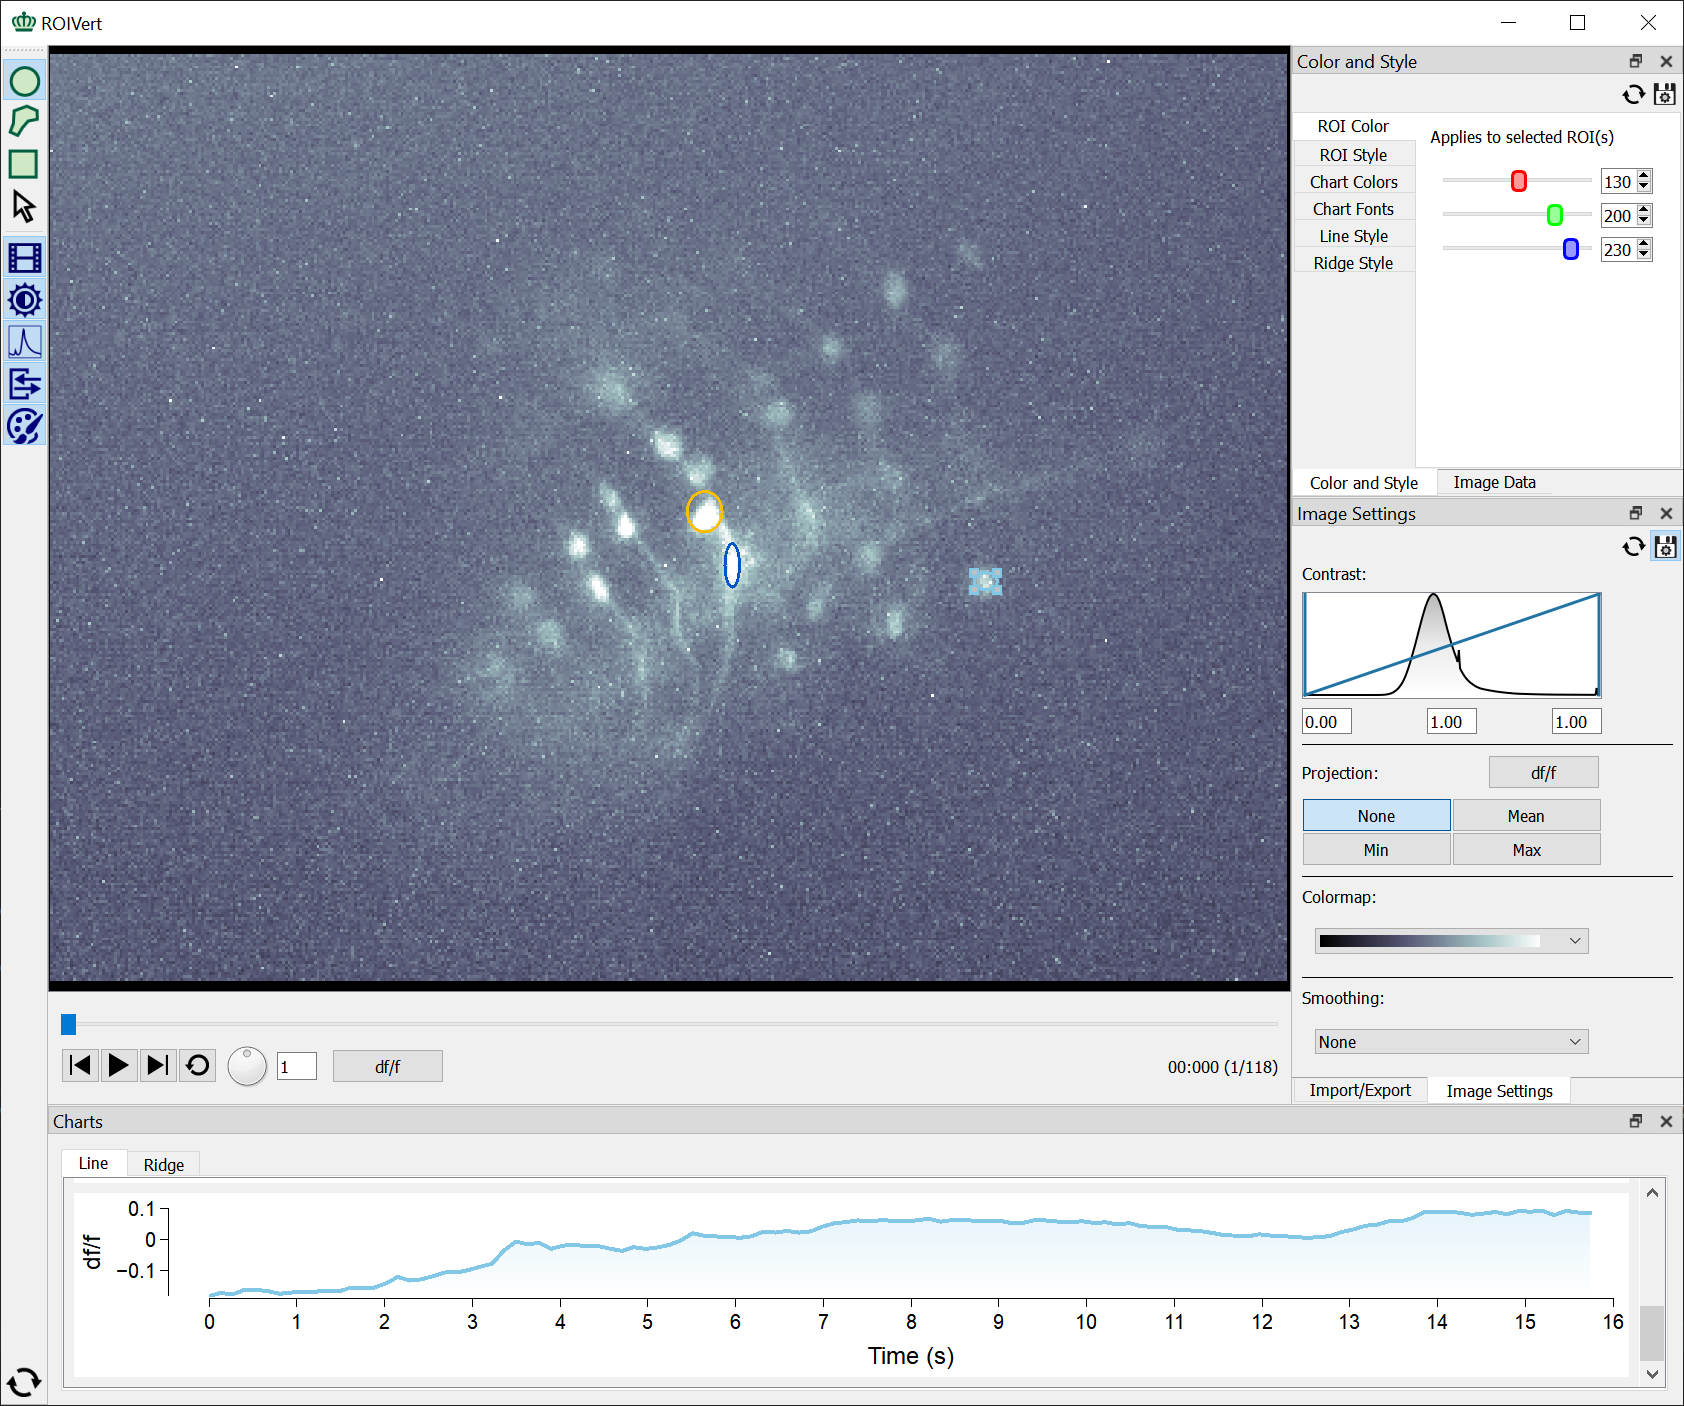
selected. To select a different ROI use the selection tool  and
ROIVert will select the ROI immediately under the mouse arrow when you click. You might notice that the
selected ROI shows up in the Charts window as a highlighted line; you can also select ROIs in the
charts window by clicking on the line. This provides an easy way to make sure you know which ROI
corresponds to which trace when there are many ROIs.
and
ROIVert will select the ROI immediately under the mouse arrow when you click. You might notice that the
selected ROI shows up in the Charts window as a highlighted line; you can also select ROIs in the
charts window by clicking on the line. This provides an easy way to make sure you know which ROI
corresponds to which trace when there are many ROIs.
Tips and Warnings
- You can select multiple ROIs by holding down the SHIFT key when clicking on a ROI or chart, and you can select all the ROIs using the keyboard shortcut Ctrl+A (⌘+A on Mac).
- You can delete the selected ROIs by pressing the delete key on your keyboard.
- Sometimes it's easier to draw a complex shape if you zoom in on the video. Hold down the Ctrl button (⌘ on Mac) on your keyboard and zoom in with the mouse wheel. You can 'pan' around the view by holding down the Ctrl (⌘ on Mac) button and dragging around the image, or you can use the scrollbars on the side.
The Toolbar
|
Opens up the Image Data Window. This is described in the section "Loading Image Data" and provides access to loading data. |
 |
Draw Elliptical ROIs. This is described in the section "Drawing ROIs" and is used for drawing ROIs that are ellipses. |
 |
Draw Polygonal ROIs. This is described in the section "Drawing ROIs" and is used for drawing ROIs that are polygons. |
 |
Draw Rectangular ROIs. This is described in the section "Drawing ROIs" and is used for drawing ROIs that are rectangles. |
 |
Select ROIs. This is described in the section "Drawing ROIs" and is used for selecting ROIs. |
 |
Toggle Image Settings Window. This button toggles the visibility of the Image Settings Window where you can adjust aspects like the contrast and color of your image. This window is described in the "Image Display Settings" section. |
 |
Toggle Charts Window. This button toggles the visibility of the Charts Window where you see graphs of the values in your ROIs over time. This window is described in the "Chart Height and Time Extents" section. |
 |
Toggle Import/Export Window. This button toggles the visibility of the Import/Export Window where you can export images of the charts, text files containing df/f values in ROIs. You can also save and load a set of ROIs. This window is described in the "Improt and Export" section |
 |
Toggle Color and Style Window. This button toggles the visibility of the Color and Style Window where you can adjust the display of ROIs and charts. The controls in this window are described in the "ROI Color and Style" section and the "Chart Color and Style" section. |
There's one more button in the toolbar at the very bottom. The reset layout button  resets various aspects of the layout which can be useful if
you've lost a window or found yourself with a configuration you don't like.
resets various aspects of the layout which can be useful if
you've lost a window or found yourself with a configuration you don't like.
The windows controlled by the blue icons in ROIVert are "dockable" - all of these windows can be
displayed in two modes: they
can be 'floating windows' which you can arrange on your desktop as you see fit, or they can be 'docked
windows' that are contained within the main ROIVert window. To undock a window just drag on the title
bar or click the button that looks like two small windows. To dock a window drag it toward the main
window. ROIVert will highlight the location where the window will be docked. Or just double click on the
titlebar to dock the window in its last location. There are many configurations available and ROIVert
will make tabs as needed to fit multiple windows into the same space. ROIVert invests so much into
various window configurations because users are unique, both in their preferences for organization and
the size of their screens! You should configure ROIVert however you like. If you ever want to go back to
the original layout, just look for the reset layout button
at the bottom of the toolbar. This will return ROIVert's layout to the factory settings.
All of the windows (except charts) also feature two small settings buttons in the top right corner. The
reset button will reset the settings for the window to
the defaults. The save settings  button allows you to save
your settings for future sessions - if this button is depressed then ROIVert will remember the values in
this window for future sessions.
button allows you to save
your settings for future sessions - if this button is depressed then ROIVert will remember the values in
this window for future sessions.
Tips and Warnings
- If there's a box with a number in it, your mouse wheel probably works to adjust the number. This is normally much easier than typing in a value for fine tuning.
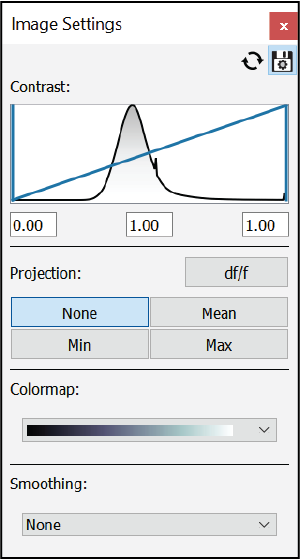
The Image Settings Window  provides control over
several
aspects of how images in the video will be displayed. These settings don't influence the computation of
df/f or the traces displayed in the charts window, they just change the display.
provides control over
several
aspects of how images in the video will be displayed. These settings don't influence the computation of
df/f or the traces displayed in the charts window, they just change the display.
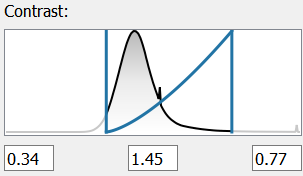
The Contrast section is a good starting point when loading a new video. You'll see a histogram which portrays a representation of the frequency of individual values in the data file. If your recording had mostly bright pixels, you'd see a distribution that was skewed toward the right, if it had mostly dim values you'd see a distribution skewed to the left.
There are three settings you can adjust, indicated by the three text boxes. You can type values directly into these boxes. However, note that they correspond to the three blue lines in the histogram window, and it's far more convenient to just drag these lines to adjust the contrast.
- The vertical line (and textbox) at the left controls the minimum brightness. By default this is set to 0.00, which means ROIVert will show all of the pixels at the low end of the brightness range. If you set this value to 0.10, ROIVert would take the dimmest 10% of pixels and treat them as if they were black. This is very useful for hiding the background (noise) and providing more dynamic range to the foreground (signal).
- The vertical line (and textbox) at the right controls the maximum brightness. By default this is set to 1.00, which means ROIVert will show all of the pixels at the high end of the brightness range. If you set this value to 0.90, ROIVert would take the brightest 10% of pixels and treat them as if they were white. This is very useful for increasing the brightness of fluorescing cells, particularly if you don't care much about subtle differences in the magnitude of fluorescence.
- The diagonal line (and middle textbox) controls a parameter often called gamma. Gamma is a powerful contrast tool that introduces a nonlinearity in the display of brightness. If you drag this line up (gamma less than 1) the image will get brighter. Pixels at the low end of the brightness range are given more weight. If you drag this line down, the image will get dimmer. Pixels at the low end of the brightness range will be given less weight
The projection section allows you to select one of three common projections of the image across time. By projection we mean that we'll collapse the time dimension in the movie using the operation shown in the window. For instance, if the mean is selected, ROIVert calculates the mean value for each pixel and displays that. A particularly useful projection is the max of the df/f (note that a df/f button here allows you to toggle df/f display, similar to the button in the video controls). Pixels that have a large maximum df/f were those that achieved a maximum over the course of the session that was far brighter than their average - coupled with smoothing this can be a good proxy for temporally limited fluorescence (or calcium transients for GCaMP expressing cells).
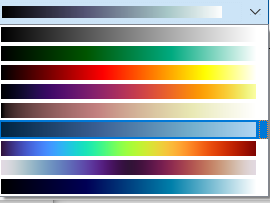
The colormap setting allows you to map the greyscale values of your recordings to colors. As the authors of OpenCV quite eloquently noteref:
The human perception isn't built for observing fine changes in grayscale images. Human eyes are more sensitive to observing changes between colors, so you often need to recolor your grayscale images to get a clue about them.
ROIVert includes several colormaps. A particularly useful one is the 'bone' style colormap which looks almost like greyscale but with a slight blue-ish tone (nicknamed bone because of its similarity to traditional x-ray images).
The final section in the Image Settings window is about smoothing. A little bit of smoothing can be very helpful in hiding some of the noise that's common in microscopy images. If you mouse over the smoothing dropdown you can learn a bit about each of the methods. The first two, Box and Median, are by far the simplest and are adequate for most needs. They simply use the mean or median of a square around each pixel to define the displayed value.
Here's a more detailed look at the smoothing types:| Box | Takes the mean in a moving rectangle. |
| Median | Takes the median in a moving rectangle. |
| Gaussian | Use a Gaussian kernel to weight the moving average. |
| Bilateral | A Gaussian filter applied spatially with a second Gaussian applied to pixel intensity difference. |
Tips and Warnings
- Picking contrast settings takes some practice. For GCaMP recordings a good starting point is to set the minimum near the base of the curve (imagine 2 standard deviations on a normal curve), the maximum much further down the tail of the distribution (remember the right tail of the distribution is where all of the 'action' is), and gamma around 1.45.
- Don't forget that you can reset
settings for any ROIVert window with the button at the
top right.
- All of the contrast settings are managed separately for df/f and raw displays, as these typically have very different ideal settings.
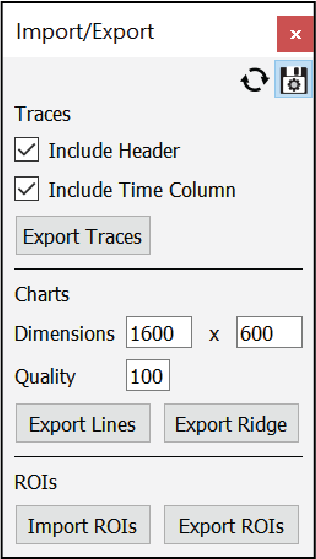
The Import/Export Window allows you to export the results of ROIVert: the traces (calculated image intensity values over time), image files showing the charts, and ROIs in a format known as JSON. The ROIs can be read back in by ROIVert, and both the traces and ROIs can be read in using numerical analysis software like Python, MATLAB, or Julia.
For traces, consider the checkbox for 'Include Time Column' which allows you to include a column that indicates the x axis of the charts. This is particularly useful if you plan to make a different type of plot in a tool like Microsoft Excel.
The dimensions on the Charts tab can be useful for sizing your exported graphics. While you can resize your graphics in elsewhere, choosing dimensions here will allow the chart's text and other decorations to be sized appropriately. The Quality box allows you to set a value used for image compression, and should only be reduced if space is a concern. When you choose the Export Lines option, ROIVert will generate an image file for each ROI.
The Import/Export ROIs buttons allow you to work across multiple sessions of ROIVert. Exporting ROIs can be useful if you want to share your results with another ROIVert user, or save them to continue working on drawing ROIs later. As noted above, these data are stored in JSON, so you can even develop your own programs to analyze ROIs and just rely on ROIVert for drawing them!
The Color and Style window contains two tabs that let you manipulate how ROIs are displayed.
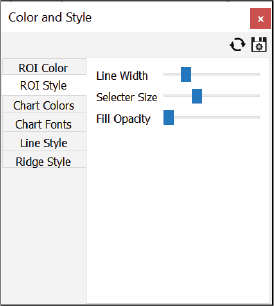
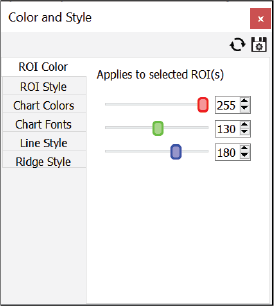
The ROI Color tab gives you control over the color of individual ROIs. Unlike other tabs in this
window, the
ROI Color applies to the currently selected ROI(s). When ROIVert first draws an ROI it selects its color
from an internal palette. This tool allows you to recolor ROIs however you'd like. Simply drag the red,
green, and
blue sliders to select a color that suits your needs. Note that you can color multiple ROIs at once -
simply select multiple ROIs by holding shift while using select mode , or use Ctrl+A (⌘+A on Mac) to select all ROIs.
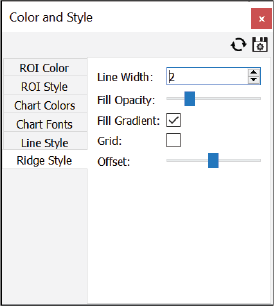
The ROI Style tab has options that let you adjust the thickness of lines, the size of the ROI selection squares, and even the opacity of a semi-transparent fill applied to ROIs. Selector size can be really important for low resolution monitors, where the little squares used for editing vertices might obscure your image or other ROIs.
- A trick with style: set the colormap to a grayscale option, the fill opacity so that it is mostly transparent, but not completely, and drag line width to the far left. Now it will look like your cells are colored in.
- Don't forget that you can reset
settings for any ROIVert window with the button at the
top right.
- Resetting won't work for ROIColor, there is no default ROIColor - each one is different!
- If you drag the "Selecter Size" slider to the far left end, selection squares will be invisible but still work, you can adjust vertices by dragging when your mouse cursor changes.
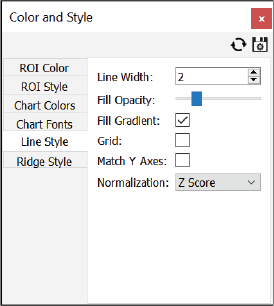
Adjust Chart Colors and Fonts using the corresponding tabs in the Color and Style window. These options apply to both Line Charts and Ridge Charts. Use the Line Style and Ridge Style tabs to control more specific features on each of these charts. Most of these options don't need much explanation, but the Normalization option in Line Style has some complexity worth discussing.
By default, traces in the charts window are shown in raw df/f. In other words, the df/f values are computed for each pixel (see the 'What is df/f and how is it calculated?' section below), the values are averaged within each ROI to produce a single value for each frame, and those values are shown on the y axes of charts. These values don't matter much if you don't select the Match Y Axes option (right above Normalization), but if you do you'll notice that some charts have large changes while other charts don't. In some ways df/f is an intuitive unit: it's an intensity value that's already been normalized and is ready to compare across ROIs. However, it can sometimes be useful to normalize differently, so ROIVert provides some additional options which are applied to the traces to determine the y axis values. Note that none of these options will change the shape of traces: they are all scaling values applied all-at-once to each trace.
| None | No normalization is applied, 'raw' df/f is shown. |
| Zero To One | Values are normalized so that the minimum is shown at 0, the maximum is shown at 1. Match Y Axes has no effect here, each Y axis will range from 0 to 1. This is (conceptually) the scaling used by ridge charts. |
| L1 norm | Values are normalized to the sum of magnitudes of values. |
| Z score | The mean is subtracted and then values are divided by the standard deviation. |
| Z score | The mean is subtracted and then values are divided by the standard deviation. |
| Median IQR | The median is subtracted and then values are divided by the inter-quartile range. |
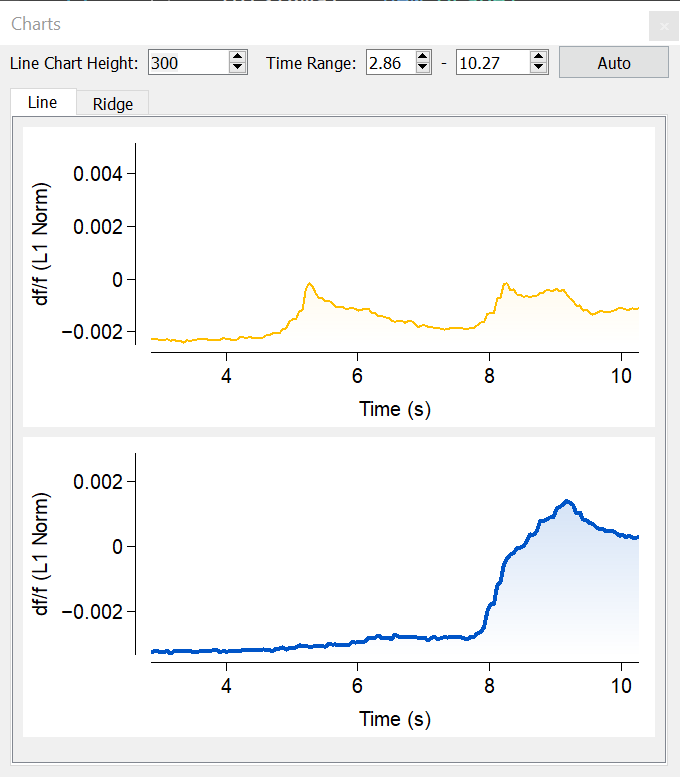
Starting in ROIVert 1.1 you can control the range of time displayed for charts, and the height of line charts. These options provide some important controls for zooming in on a time that might be important for your experiment, or controlling the aspect ratio of your charts.
To change the hieght of line charts, adjust the "Line Chart Height" value at the top left of the Charts Window. This number is measured in pixels, and has a minimum (which depends in part on the size of fonts). The largest setting in here is just shy of a million pixels, but it's unlikely that you have a display that big!
Similarly the span of the x-axis can be adjusted by choosing values to the right of Time Range. There's also an 'Auto' button which will bring your range back to one ROIVert chooses. In many cases, this will the span of your data, but ROIVert has some special logic that it uses to choose the upper limit of values when they're very close to a round number.
- Setting the Line Chart Height with numbers can be tedious. Using the scollbar on the box is good for fine tuning, but for quick changes, hold down Ctrl (⌘ on Mac) and use the scroll wheel on your mouse.
- Setting the Time Range with numbers is good if you have an event you're interested in at a specific time, but to zoom in on a part of the chart you're interested in hold down Ctrl (⌘ on Mac) and drag across a chart.
- The Ridge Chart's height just depends on the height of the window.
df/f (more properly δF/F) refers to the change in fluorescence over...fluorescence.
To calculate df/f one takes some fluorescence values, subtracts a baseline state, and then divides the whole thing by that baseline state.
\[{\delta F \over F} = {F-F_0 \over F_0}.\]
The baseline is calculated differently from one study to the next. Some researchers have an experimental baseline state that they use for calculating df/f, while others (as ROIVert does) use the average of an entire recording as a proxy for a baseline.
When you click the df/f button in ROIVert's video controls, you see the movie transform to a df/f movie. ROIVert (on loading the video) has gone through each pixel and calculated the average for the pixel over time. Then ROIVert has created a new movie where each pixel shows its value, minus the average, divided by the average.
The traces ROIVert shows take the average of the 'pixel-wise' df/f values within the ROI for each frame.